COVID-19 Weekly Unemployment Claims
We’ve seen unprecedented new weekly unemployment claim numbers. On one hand it should not be surprising given that the Federal Government, and State and local Government officials are asking that businesses are shut down.
Week one of shut down orders
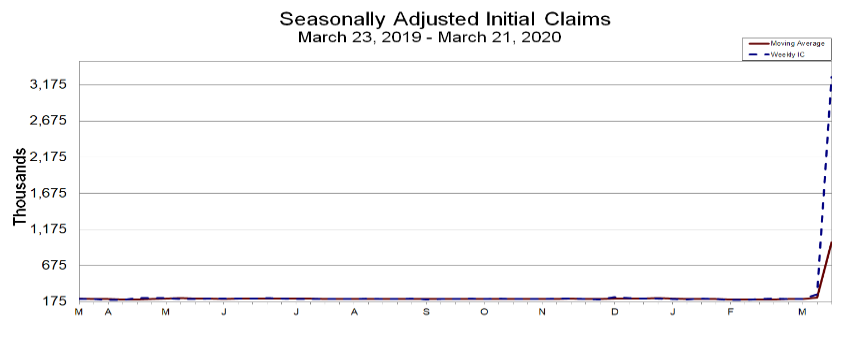
The prior weeks were used to reporting figures in the thousands of new jobless claims. The report broke the scale. US Department of Labor release notes:
In the week ending March 21, the advance figure for seasonally adjusted initial claims was 3,283,000, an increase of 3,001,000 from the previous week’s revised level. This marks the highest level of seasonally adjusted initial claims in the history of the seasonally adjusted series. The previous high was 695,000 in October of 1982. The previous week’s level was revised up by 1,000 from 281,000 to 282,000. The 4-week moving average was 998,250, an increase of 765,750 from the previous week’s revised average. The previous week’s average was revised up by 250 from 232,250 to 232,500.
Week two of shut down orders
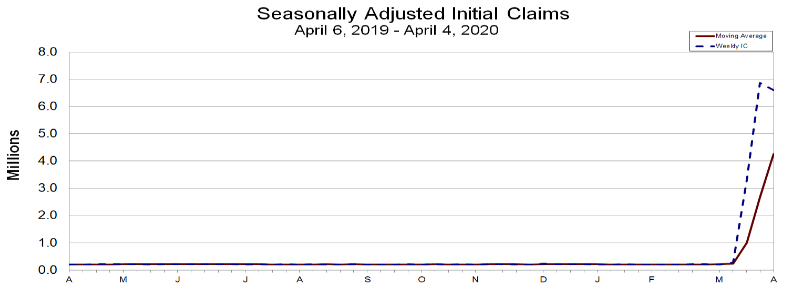
Week two of a post COVID-19 world the US Department of Labor changed the scale to millions. Scaling far above the “moving average”. US Department of Labor release notes:
In the week ending March 28, the advance figure for seasonally adjusted initial claims was 6,648,000, an increase of 3,341,000 from the previous week’s revised level. This marks the highest level of seasonally adjusted initial claims in the history of the seasonally adjusted series. The previous week’s level was revised up by 24,000 from 3,283,000 to 3,307,000. The 4-week moving average was 2,612,000, an increase of 1,607,750 from the previous week’s revised average. The previous week’s average was revised up by 6,000 from 998,250 to 1,004,250.

There are smart economic forces saying that a likely real world USA unemployment rate is close to 10%, this is a figure that is only compared with the last major downturn The Great Recession, some of you may know that Career Purgatory was born in the throws of the Great Recession.
Week three of shut down orders
For the week ending April 3, 2020 which we are still in it is very likely that we see another multi-million new weekly unemployment filing figure. Reason is that as of this week Michigan’s unemployment website crashed due to demand, and they were still asking contract, and gig-workers to hold off on applying for unemployment. Typically these workers would never qualify for unemployment. So expect big increases to the unemployment claim figures moving forward as additional states get these contract and gig workers processed. Additionally not every state has mandatory shelter-in place orders. Only this week did the state of Pennsylvania even start their shelter in place order. Lastly the Federal Government extended travel advisory / social distancing guidelines until April 30, 2020. Prediction is we see figures in the 5 to 5.5 million new claims for this week.
April 6, 2020 Former Federal Reserve Chair Janet Yellen estimates that the entire US unemployment rate is already at 12-13%.
The actual weekly figure for new initial unemployment claims came in at 6,606,000.
Per US Department of Labor:
In the week ending April 4, the advance figure for seasonally adjusted initial claims was 6,606,000, a decrease of 261,000 from the previous week’s revised level. The previous week’s level was revised up by 219,000 from 6,648,000 to 6,867,000. The 4-week moving average was 4,265,500, an increase of 1,598,750 from the previous week’s revised average. The previous week’s average was revised up by 54,750 from 2,612,000 to 2,666,750.
The largest increases in initial claims for the week ending March 28 were in California (+871,992), New York (+286,596), Michigan (+176,329), Florida (+154,171), Georgia (+121,680), Texas (+120,759), and New Jersey (+90,438), while the largest decreases were in Nevada (-20,356), Rhode Island (-8,047), and Minnesota (-6,678).
Week four of shut down orders
Per the US Department of Labor:
In the week ending April 11, the advance figure for seasonally adjusted initial claims was 5,245,000, a decrease of 1,370,000 from the previous week’s revised level. The previous week’s level was revised up by 9,000 from 6,606,000 to 6,615,000. The 4-week moving average was 5,508,500, an increase of 1,240,750 from the previous week’s revised average. The previous week’s average was revised up by 2,250 from 4,265,500 to 4,267,750.

Interesting trends in state unemployment increases or decreases week over week:
The largest increases in initial claims for the week ending April 4 were in Georgia (+256,312), Michigan (+84,219), Arizona (+43,488), Texas (+38,982), and Virginia (+34,872), while the largest decreases were in California (-139,511), Pennsylvania (-127,037), Florida (-58,599), Ohio (-48,097), and Massachusetts (-41,776)
Career Purgatory commentary on this latest unemployment filing figures is that, while it shows an overall weekly “decrease” from the prior 6 million figure, it is important to note that many states still could not process the CARES Act self-employed, 1099, and “gig worker” unemployment claims. We might see those show up next week. In which case we presume we’ll see an increase in the unemployment filing from 5,245,000 million.
Worse still, effectively nearly 11 years worth of all job gains since the end of the Great Recession (June 2009) have been erased.
BREAKING: Over 22 million Americans have now filed for jobless claims since the coronavirus crisis began, nearly wiping out all the job gains since the Great Recession. https://t.co/ebgA64BcMj
— CNBC Now (@CNBCnow) April 16, 2020
Week five of COVID-19 Coronavirus shutdowns
US Department of Labor statement:
In the week ending April 18, the advance figure for seasonally adjusted initial claims was 4,427,000, a decrease of 810,000 from the previous week’s revised level. The previous week’s level was revised down by 8,000 from 5,245,000 to 5,237,000. The 4-week moving average was 5,786,500, an increase of 280,000 from the previous week’s revised average. The previous week’s average was revised down by 2,000 from 5,508,500 to 5,506,500.

The advance seasonally adjusted insured unemployment rate was 11.0 percent for the week ending April 11, an increase of 2.8 percentage points from the previous week’s unrevised rate. This marks the highest level of the seasonally adjusted insured unemployment rate in the history of the seasonally adjusted series.The advance number for seasonally adjusted insured unemployment during the week ending April 11 was 15,976,000, an increase of 4,064,000 from the previous week’s revised level.
Our bolding above, this is the highest seasonally adjusted unemployment rate ever recorded. We have effectively a national unemployment rate of 11%, and 15,976,000 million Americans without work, and more than likely little to no way to seek work as most businesses with the transferable skills that are deemed “non-essential” are also likely closed for being, well “non-essential”.
As of April 4, 2020 the highest unemployment insured rates were:
- Michigan 17.4%
- Rhode Island 15.0%
- Nevada 13.7%
- Georgia 13.6%
- Washington 13.2%
- New Hampshire 12.2%
- Minnesota 11.9%
- New York 11.9%
- Montana 11.7%
- Ohio 11.6%
The labor secretary also issued a separate statement on the situation:
Week six of COVID-19 Coronavirus shutdowns
US Department of Labor statement:
In the week ending May 2, the advance figure for seasonally adjusted initial claims was 3,169,000, a decrease of 677,000 from the previous week’s revised level. The previous week’s level was revised up by 7,000 from 3,839,000 to 3,846,000. The 4-week moving average was 4,173,500, a decrease of 861,500 from the previous week’s revised average. The previous week’s average was revised up by 1,750 from 5,033,250 to 5,035,000.

The advance seasonally adjusted insured unemployment rate was 15.5 percent for the week ending April 25, an increase of 3.1 percentage points from the previous week’s unrevised rate. The advance number for seasonally adjusted insured unemployment during the week ending April 25 was 22,647,000, an increase of 4,636,000 from the previous week’s revised level. The previous week’s level was revised up 19,000 from 17,992,000 to 18,011,000. The 4-week moving average was 17,097,750, an increase of 3,800,250 from the previous week’s revised average. The previous week’s average was revised up by 5,000 from 13,292,500 to 13,297,500. “
The highest insured unemployment rates in the week ending April 18 were in:
- Vermont 25.2%
- West Virginia 21.9%
- Michigan 21.7%
- Rhode Island 20.4%
- Nevada 19.9%
- Connecticut 18.7%
- Puerto Rico 17.9%
- Georgia 17.3%
- New York 17.2%
- Washington 17.1%
Reported by CNBC the weekly jobless claims the last seven weeks are now north of 33.5 million.
Week seven of COVID-19 Coronavirus shutdowns and some state restarts
In the week ending May 9, the advance figure for seasonally adjusted initial claims was 2,981,000, a decrease of 195,000 from the previous week’s revised level. The previous week’s level was revised up by 7,000 from 3,169,000 to 3,176,000. The 4-week moving average was 3,616,500, a decrease of 564,000 from the previous week’s revised average. The previous week’s average was revised up by 7,000 from 4,173,500 to 4,180,500.
In the week ending May 9, the advance figure for seasonally adjusted initial claims was 2,981,000, a decrease of 195,000 from the previous week’s revised level. The previous week’s level was revised up by 7,000 from 3,169,000 to 3,176,000. The 4-week moving average was 3,616,500, a decrease of 564,000 from the previous week’s revised average. The previous week’s average was revised up by 7,000 from 4,173,500 to 4,180,500. The advance seasonally adjusted insured unemployment rate was 15.7 percent for the week ending May 2, an increase of 0.3 percentage point from the previous week’s revised rate.
The highest insured unemployment rates in the week ending April 25:
California 27.7%
- Michigan 23.1%
- Nevada 22%
Pennsylvania 21.2%
- Rhode Island 20.6%
- Georgia 20.2%
- Vermont 20.0%
- New York 18.6%
- Connecticut 18.0%
- Washington 18.0%

36.5 million jobs have been lost in the last seven weeks, completely erasing the last ten years of job gains, and now putting the US employment picture into a situation as bad, and likely worse than the Great Recession.